
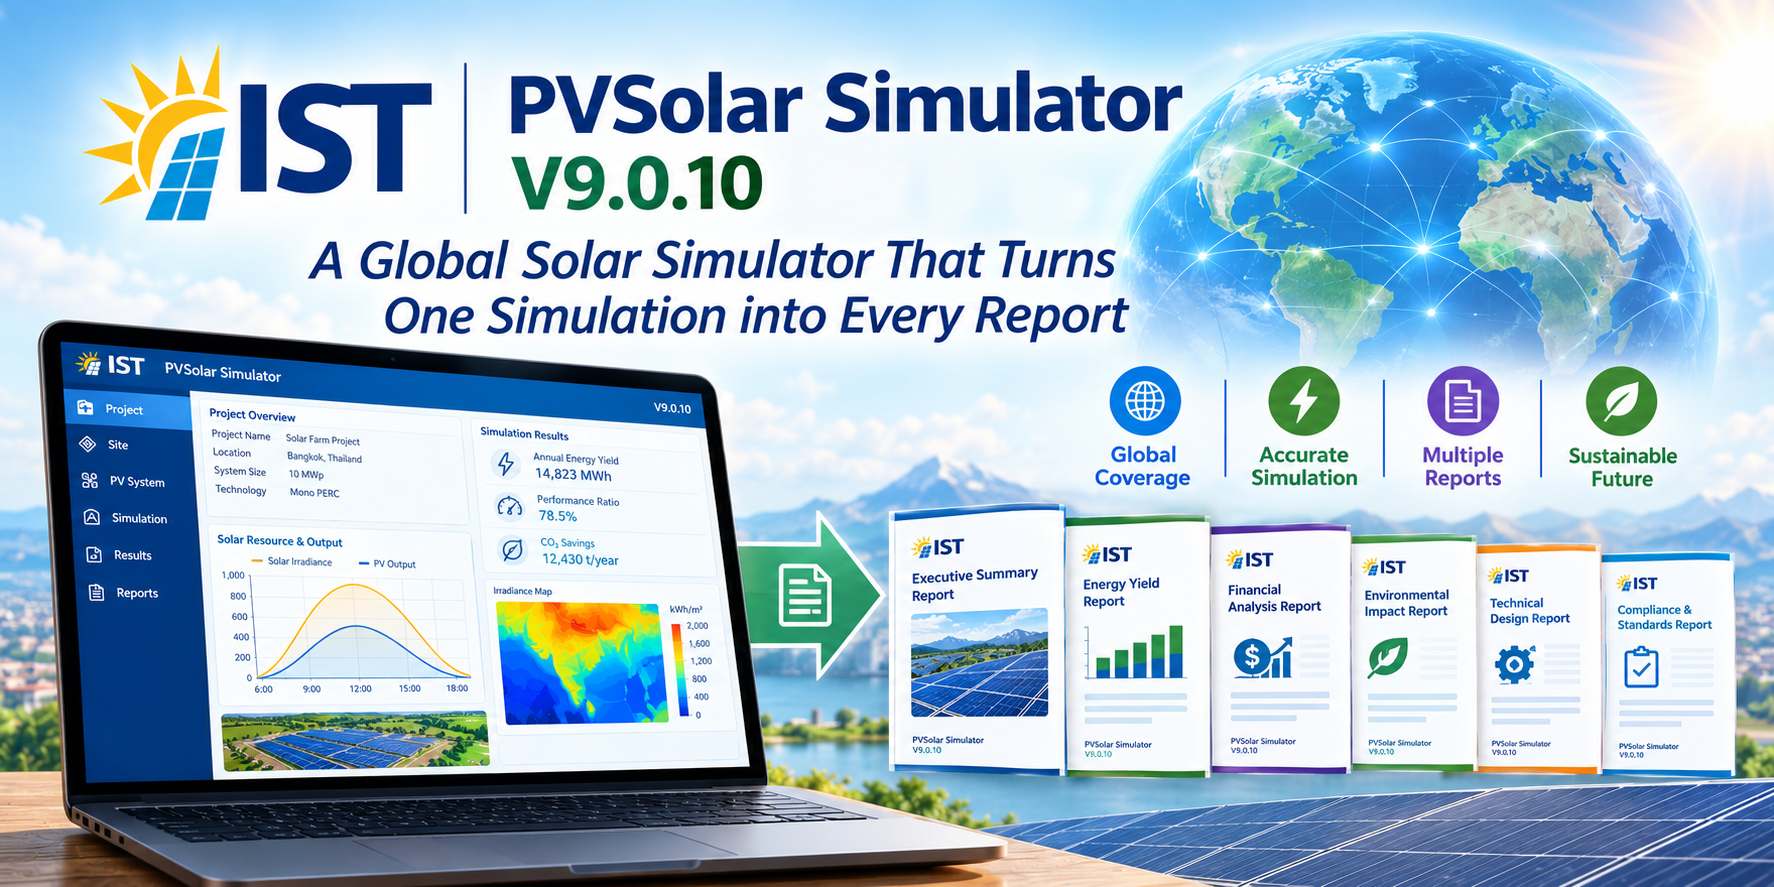
IST PVSolar Simulator V9.0.10: A Global Solar Simulator That Turns One Simulation into Every Report
A solar project in Pune, Lagos and Selangor will meet three different utilities, three tax systems and three export rules. The engineering is the same in all three: sunlight, modules, inverters and losses. Everything around it changes with the country.
Most PV tools stop at the energy yield. The engineer then exports a number, rebuilds the cable schedule in a spreadsheet, retypes the financials for the lender and drafts the feasibility report in Word. Every hand-off adds rework, and every design change means updating four files.
IST PVSolar Simulator V9.0.10 removes those hand-offs. You describe the site and the system once and run one simulation. Every technical and commercial report is then generated from that same result, in the currency, standards and rules of the country you are building in.
One simulation, one source of truth
IST PVSolar Simulator is a browser-based platform for designing, simulating and financing grid-connected PV plants, from a 5 kW rooftop to a utility-scale ground-mount plant. Nothing needs to be installed.
It follows international methods throughout:
- IEC 61724-1 performance accounting
- A single-diode (De Soto) cell model
- Perez sky transposition
- IEC 60364-7-712 for PV electrical design
The economics, bankability analysis and report generators all read from the same simulation. Change the module, the tariff or the loan rate, run again, and the yield, cash flow and documents update together.
A global simulator, not a regional one
Select a Country / Market and the whole project adapts. The list covers 125 countries across South Asia, Southeast Asia, Africa and Europe, plus the USA, UAE, Saudi Arabia and Australia.
| What changes with the country | Example |
|---|---|
| Currency and number format | ₹ lakh/crore in India, KSh in Kenya, RM in Malaysia |
| VAT / GST on equipment | 16% in Kenya, 18% in Sri Lanka, 7% in Thailand |
| Grid export credit | Net metering in Kenya (up to 10 kW), net billing in Nigeria (0.55 × tariff), no export credit in Indonesia, Solar ATAP in Malaysia |
| Tax and depreciation preset | Section 12B in South Africa, 40% WDV in India, 20-year effective life in Australia |
| Standards and utility wording | DISCOM and CEA in India, Kenya Power and KS IEC in Kenya, PLN and PUIL in Indonesia |
Many tools are built around European or US assumptions, such as stable grids, temperate climates and standard net metering, and leave engineers to patch the gaps. Here the local rules are built in.
South Asia
India, Sri Lanka and Bangladesh have full profiles. Pakistan, Nepal, Bhutan, the Maldives and Afghanistan use a South Asia regional profile with their own currency, VAT/GST rate and grid CO₂ factor.
India is the reference market. Drawings cite BIS IS 16169, the CEA Regulations 2010, IS 3043 earthing and the MNRE ALMM context, and name the DISCOM. The tax preset is 25.17% under Sec. 115BAA with 40% WDV. Sri Lanka’s profile carries PUCSL Net Accounting tiers, and Bangladesh’s follows the Net Metering Guidelines 2025.
Southeast Asia
Eleven countries are covered. Malaysia, Thailand, Indonesia and Cambodia have full profiles, and seven others use a regional profile.
Many of these markets pay little or nothing for exports, so the business case rests on self-consumption. The simulator models Malaysia’s Solar ATAP, where the 10-year energy offset switches to self-consumption afterwards. It also handles Thai household buyback, Indonesia’s self-consumption-only rule and Cambodia’s EAC process. Incentives such as Thailand’s BOI exemption and Cambodia’s QIP holiday are entered as a Tax Holiday, so they show up in every year’s cash flow.
Africa
All 54 African countries are covered. South Africa, Nigeria, Kenya, Zimbabwe and Rwanda have full profiles, and the other 49 start in their own currency, with local VAT and grid CO₂ factors. A Ghana project starts in cedi, not dollars.
Export rules follow system size automatically. In Nigeria, a 40 kWp system gets no export credit, while a 200 kWp system is credited at 0.55 × tariff under the 2026 Net Billing Regulations. Kenya’s net metering stops at 10 kW. In markets with frequent outages, the storage study is often the deciding part of the design.
All of these values are indicative starting points and stay editable. Administrators can update a country centrally when a regulation changes, and each user can save their own values in the Database tab.
The engineering behind a bankable yield
The engine runs at monthly, hourly (8,760 steps) or 15-minute (35,040 steps) resolution. The hourly and sub-hourly runs are the ones meant for bankable reports.
- Weather data: import PVGIS typical years in one click, or upload your own hourly TMY file from Solargis, Meteonorm, Solcast, NSRDB, PVsyst or an EPW. A measured hourly TMY tightens the resource uncertainty from ±5% to ±2.5%.
- Physics chain: Perez transposition, Martin–Ruiz incidence-angle losses, air-mass spectral correction, the Faiman thermal model, the De Soto module model, DC losses, degradation and inverter efficiency with true AC clipping.
- 3D shading: upload a drone orthomosaic, trace roofs and obstructions, and lay out real panels. The result is an hourly shading profile instead of a flat percentage.
- Bifacial and trackers: an unlimited-sheds view-factor model for rear-side irradiance, plus single-axis trackers with backtracking.
- Datasheet-based components: build modules and inverters from a manufacturer’s PDF datasheet, with no .PAN or .OND files required.
- Local climate notes: each market profile carries its own soiling and climate guidance into the reports, from harmattan dust in Nigeria to the monsoon and haze seasons in Malaysia.
The technical reports, generated from the same run
Once the simulation runs, the electrical package is built from the same design data, so the drawings always match the yield model:
- Protection and cable schedule: cable sizes, gPV string fuses, protection ratings and voltage-drop checks against your actual route lengths, under IEC 60364-7-712, IEC 60269-6 and the market’s wiring code.
- Wiring diagram: every string routed through the DCDB, MPPT and inverter, mirroring the 3D layout.
- Earthing and lightning protection: electrode resistance, earth pits, conductor size and ESE air-terminal count and mast height.
- Simulation report: yield, performance ratio, loss diagram and 25-year projections.
The commercial reports, from yield to investment decision
A project is judged twice. The engineer asks how much energy it will produce. The investor asks what that energy is worth and how sure we can be. Because both answers come from one model, the economics never drift from the engineering.
- Uncertainty. Four sources are combined into P50, P75, P90 and P95 yields. These are inter-annual variability, resource data, model and components. The financial model runs on conservative P90 energy, not the P50 headline.
- Project economics. CAPEX line by line with VAT/GST and input-tax credit, OPEX with escalation, and the tariff or PPA with annual escalation. The outputs are LCOE, NPV, project IRR, ROI, profitability index, simple and discounted payback, break-even tariff and a year-by-year cash flow in local currency.
- Financing and equity returns. Loan sizing, tenor, moratorium, DSRA, equity IRR, minimum DSCR and LLCR, tested against the covenant thresholds the lender sets. The model also checks CAPEX per Wp against country benchmark bands.
- Monte Carlo risk. By default, 20,000 trials turn energy uncertainty into P10, P50 and P90 ranges for NPV, equity IRR, LCOE and DSCR.
- Risk score. A 0–100 composite from Investment Grade to Speculative, with a hard override if NPV or DSCR fails.
- Scenario testing. Change the CAPEX, tariff escalation, discount rate or loan terms, or compare a tracker against a fixed tilt, and watch the effect flow through to the economics.
This all feeds three documents:
- Bankability Assessment Report: the format a lender’s engineer expects, with resource quality, P50/P90 yields, DSCR, risk grading, country risk, currency/FX mismatch and a due-diligence checklist.
- Draft DPR: a lender-style Detailed Project Report in Word, with 19 chapters and Annexures A–L. The SLD, loss diagram and charts are embedded, and the policy chapter can be drafted from a live web search for the project’s country.
- EPC Proposal and BOQ: a client-facing proposal and bill of quantities, pulled live from the design and financials.
Who benefits
| User | What they get from one run |
|---|---|
| EPC contractors and installers | Quotation, BOQ, cable schedule, wiring diagram and earthing design, ready to send |
| Project developers | Yield, returns and a DPR for investors and approvals, in local currency and rules |
| Consultants and lender’s engineers | P50/P90 yields, uncertainty, DSCR and a bankability report to review |
| Banks, DFIs and investors | DSCR, equity IRR, country risk and the risk score against their own covenants |
| Students and researchers | Sensitivity analysis, uncertainty, SCADA benchmarking and IEC 61724 loss accounting in the Research tab |
From site to DPR in seven steps
- Project and site: choose the country, enter the location and import a weather year.
- Orientation: set tilt and azimuth, or let the tools suggest the best orientation and row pitch.
- System design: select modules and inverters and build sub-arrays with live string-voltage checks.
- Losses: confirm soiling, wiring, mismatch, degradation and other losses.
- Economics: enter CAPEX, OPEX, financing, the export-credit rule and the tax preset.
- Run the simulation: one hourly or sub-hourly run gives yield, PR, losses, P50/P90 and lifetime energy.
- Generate: open the reports, drawings, schedules and DPR, all filled from that run.
Start free
Every new member is activated on the Free Plan at sign-up. It covers project setup, orientation, module and inverter selection, sub-array design and the full simulation engine, and reports carry a DEMO VERSION watermark. Paid plans unlock 3D Shadow Analysis, Economic Evaluation and Bankability, the component databases, and EPC Proposals and BOQ. The Research tab comes with the higher tiers.
Design once, deliver everything
A solar project is one plant, so it should be one model. With IST PVSolar Simulator V9.0.10, the yield, the money and the paperwork come from the same run, whether the site is in Nairobi, Colombo, Bangkok or beyond.
Create a free account at istpvsolarsimulator.com, set the country, import the weather, run once, and send the client, the lender and the utility everything they need.
Tariffs, tax rates, exchange rates and policy rules in the simulator are indicative starting points. Confirm current values with your utility, regulator and a tax adviser before issuing a bankable report.